Copilot Studio Agent Metrics: The Skill to Learn Now
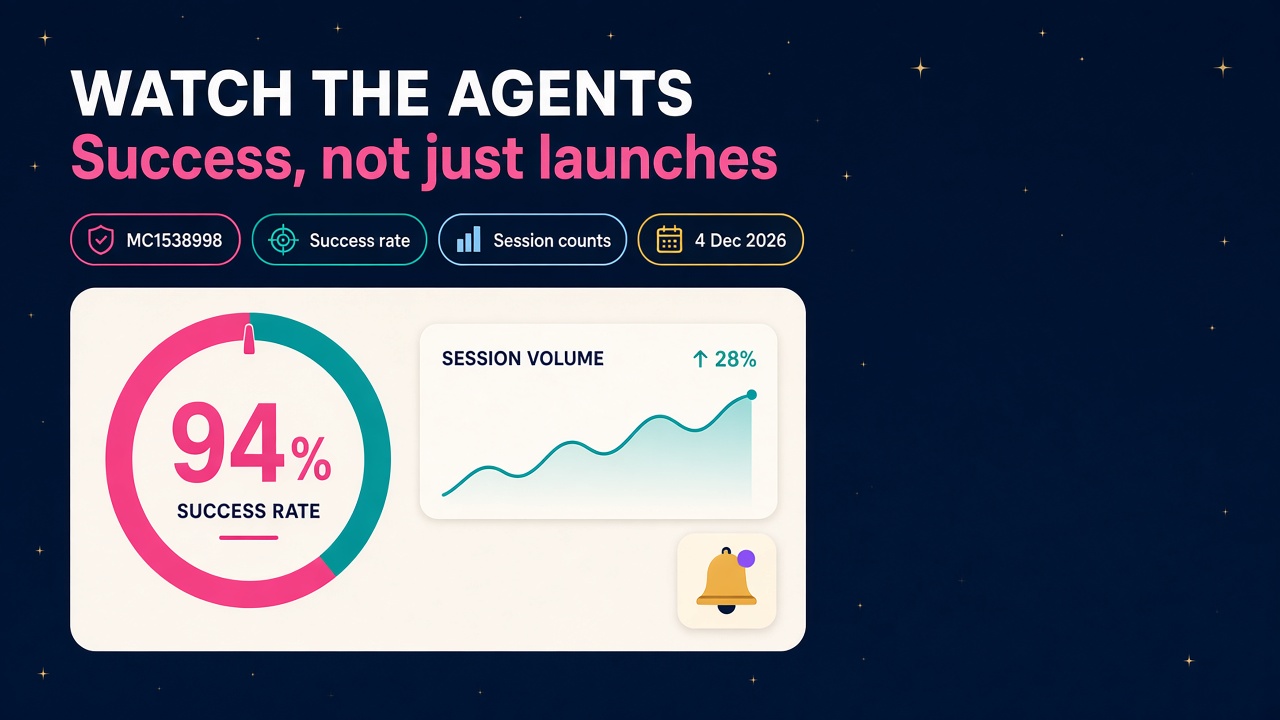
MC1538998 brings Copilot Studio agent success rates and daily session counts into Power Platform Monitor, with Managed Environment alerts by 4 December 2026.
For the last few weeks Microsoft has been shipping agents into Dynamics 365 as if it were going out of fashion. The Sales Development Agent, the Project Operations Approvals Agent, Contact Center playbooks, Dataverse skills that work in coding agents and Copilot Cowork. If you build things, you have had plenty to get your teeth into.
The next skill is less glamorous and, I think, more valuable. Someone has to watch whether those agents actually work.
On 5 November 2026 Microsoft published Message Center notice MC1538998. It announced metrics and alerts in Power Platform Monitor for agents created in Copilot Studio, reaching general availability by 4 December 2026. Two numbers land in the same place admins already watch apps and flows: agent session success rate, and recent agent sessions. In Managed Environments you can set your own thresholds and get an email when success drops.
That is the difference between launching an agent and running one. The people who can do the second will be in demand.
What Microsoft actually announced
The notice is short and worth reading in Microsoft's own words. Admins will be able to monitor the operational health and usage of conversational and autonomous agents under their purview with two new metrics:
- Agent session success rate: the percentage of successful autonomous tasks, or of conversational sessions that were successfully resolved.
- Recent agent sessions: the daily count of distinct agent sessions.
For agents in Managed Environments, admins can also configure custom thresholds and optional email notifications to help identify agents whose session success rate falls below a configured threshold. Microsoft says no action is required. That is true if all you care about is staying out of trouble. It is not true if you want to be the person who can prove an agent is earning its keep.
The official Learn page already documents both metrics and how to view them. Sign in to the Power Platform admin center, open Monitor, and under Products select Copilot Studio. You will see conversational and autonomous agents created in Copilot Studio. Microsoft's rollout date is 4 December, so treat this as something to learn and prepare now rather than something every tenant will already have on the screen this morning.
The two numbers that matter
Agent session success rate
This is the health number. For an autonomous agent it describes how often the agent successfully executes its task. For a conversational agent it describes how often a session is successfully resolved.
It is a simple percentage, which is exactly why it is useful in a conversation with a sponsor. "We launched an agent" is a project update. "This agent is resolving 94 percent of its sessions, and here is what we are doing about the other 6 percent" is an operations update. The second sentence is the one that keeps a budget alive.
You will want to know what "resolved" means in your own agents, because a session can look successful on paper and still leave a customer or a colleague unhappy. Pair the admin metric with the maker-side view in Copilot Studio, where you can see run outcomes, which tools fired, and which knowledge sources caused errors. The admin number tells you something is off. The maker view helps you see why.
Recent agent sessions
This is the usage number. Microsoft defines a session as starting when a user opens the agent and ending after a period of inactivity or when the agent is closed. The metric is a daily count of distinct user sessions.
Usage without success is noise. Success without usage is a science experiment. You need both, and you need them side by side, because they answer different questions. A success rate of 99 percent on four sessions a day might mean the agent is beautifully built and almost nobody is using it. A success rate of 70 percent on two thousand sessions a day means people are leaning on it and it is letting them down.
Unused agents do not appear in Monitor at all. Metrics are calculated from runtime activity, so an agent that was published and then ignored simply will not show up. If you are reviewing a landscape and something is missing, check whether anyone is actually calling it before you assume the reporting is broken.
How this sits next to the maker view
Admins and makers are looking at related data from different seats.
According to Microsoft's Monitor overview, Power Platform service admins and Dynamics 365 admins can view Monitor data across the tenant. Makers can view data only for resources they have edit privileges for. Tenant-level analytics must be turned on or none of this data appears. Recommendations, the hints about how to improve a weak metric, are only available in Managed Environments.
Copilot Studio does not have a monitoring page in its maker portal the way Power Apps does. Microsoft points makers to the Analytics tab for a similar experience. For autonomous agents there is also a dedicated Monitor page in Copilot Studio that covers run outcomes, trigger use, tool use and knowledge source use, with a time range you can stretch back as far as 360 days.
The admin view is the estate. The maker view is the individual agent. A good operating rhythm uses both. The CoE or platform team watches Monitor for agents that are busy and unhealthy. The maker or the consultant who owns that agent then opens Copilot Studio and digs into failed runs, weak tools and noisy knowledge sources.
A few practical limits are worth knowing before you promise anyone a live dashboard:
- Metrics are daily aggregates, not real time. Microsoft calculates them from runtime event logs.
- Metrics are available for up to 28 days.
- The event logs behind them are available for up to seven days.
- For agents that use GitHub Copilot to map sessions to outcomes more accurately, Microsoft says the metrics can appear in Monitor up to 48 hours after usage.
None of that makes the feature any less useful. It does mean you should not tell a steering group you will page someone the second an agent hiccups. This is operational health, reviewed on a daily cadence, with an hourly option if you need it for a handful of critical agents.
Alerts turn a chart into a job
Numbers on a page only help if someone looks at them. Alerts are how you stop relying on someone remembering to open Monitor on a Monday.
Microsoft's alerts documentation is clear about the prerequisites. You must be a tenant administrator or an environment administrator. You can only place custom alerts on a Managed Environment. You must be using the new Power Platform admin center.
Creating a rule is straightforward. In Monitor, open Alerts, choose + Alert rule, and set the product to Copilot Studio. You can scope the rule to an environment (every agent of that type in that environment) or to a specific agent. Then you pick the metric, an operator (Is Under, Is Over or Equals), a threshold, a severity of Low, Medium or High, and a notification type.
If you choose Email, you and up to four other recipients get a message from PowerPlat-noreply@microsoft.com when the rule fires. If you choose None, you have to go back into Monitor to see what happened. Severity is a label for triage and reporting. It does not change how often the rule is evaluated, and it does not make the email arrive any faster.
A tenant can have 50 alert rules turned on at once. You can create as many as you like, so the sensible move is to turn off or delete the ones nobody is acting on. Microsoft itself suggests starting small: a few high-value rules, consistently named, with mailboxes that can actually receive mail from that Power Platform address.
There is also a predefined alert from Microsoft: high-use agents have a success rate under 90 percent. High use, in this case, means recent agent sessions of 200 or more. These predefined alerts are tenant-wide, turned on by default, and you cannot edit them. They also do not send email. You find them on the Monitor overview page under triggered alerts for high-use items.
Treat the predefined alert as a hint, not a service level. Two hundred sessions and 90 percent may be the right bar for a busy internal helper, and far too loose for an agent that talks to customers or posts into Finance. Once you know which agents matter, create a custom alert with a threshold your business would actually defend.
If you want to go a bit further
Two preview capabilities are worth knowing about if you look after production agents.
By default, Monitor metrics refresh every 24 hours and alert rules evaluate after those daily aggregates are produced. If you set the data review period to 1 hour on a resource-scoped rule, Monitor starts producing hourly aggregates for that one metric on that one resource, and the rule can fire each hour after new hourly data arrives. This is not real time, and Microsoft is explicit about that. Agent session success rate is a supported metric. Low-latency alerts are resource-scoped only, not environment-wide. Each tenant can configure up to 10 of them, and only one per resource per metric. Reserve them for the agents that would genuinely hurt if they went wrong for a full day before anyone noticed.
You can also route alert notifications into the tools your team already uses. The Power Platform for Admins V2 connector has a When an alert fires trigger, still in preview, which can start a cloud flow and post to a Microsoft Teams channel, create an Azure DevOps work item, or hand off to another connector such as ServiceNow. That currently needs a tenant-admin account for the connection. You opt a rule in by setting its notification type to Connector, or to Email and connector if you still want the inbox message as well. Rules with a 1-hour data review period cannot use this trigger yet.
Teams that already send runtime telemetry to Application Insights can keep doing so. Microsoft positions Monitor as the place that does not need an Azure subscription and that can attach recommendations to a weak metric. Application Insights remains the richer store if you want longer retention, custom traces and the ability to join events across resources.
Why this is such good news for D365 careers
I have been around business software and recruitment tech long enough to know that new features create two kinds of work: the work of building the thing, and the work of keeping it honest. The second kind is quieter, and it tends to pay for longer.
Plenty of organisations will soon have Copilot Studio agents sitting in front of Dynamics 365 processes. Some will draft outreach. Some will approve time or expenses. Some will answer customers. The ones that work will become part of how the business runs. The ones that do not will become a story someone tells about AI not being ready.
Somebody has to own that distinction. That somebody is often a Power Platform admin, a centre of excellence lead, a solution architect, or a consultant on a managed service. Being able to walk into a review with session counts, success rates, alert history and a clear next action makes those roles more valuable still.
If you are hiring, start asking candidates how they would watch an agent after go-live. Not "have you built an agent", but "how would you know it was failing, who would be told, and what would you look at first". Have a look at current D365 jobs and you will already see admin, architect and managed service roles that this skill slots into neatly.
If you are a consultant, a monthly agent health review, built on Monitor plus the maker analytics in Copilot Studio, is a concrete deliverable. It also plays nicely with the wider shift toward partners being rewarded for adoption and ongoing value rather than a single go-live date. And if you work client-side, you now have a scoreboard for the sponsor who keeps asking whether the agents are "working". You do not need to invent a dashboard from scratch. Turn the metrics on, pick thresholds that mean something, and make sure a human is on the other end of the email.
None of this requires you to become a data scientist. It does require you to get comfortable in the Power Platform admin center, understand Managed Environments, and treat agents with the same operational seriousness you would give a production canvas app or a cloud flow. Pay will not jump overnight because a Message Center item landed, but skills that prevent embarrassing production failures have a habit of showing up in reviews. Check our D365 salary data so you know what the market is paying for platform and architecture roles before you next talk about yours.
Practical things you can do this week
Here is a list you can actually work through, whether you are an admin, an architect, a consultant or the person who got volunteered to "look after the agents":
- Confirm tenant-level analytics is on. If it is not, Monitor will have nothing to show you, regardless of how many agents you have published.
- Check whether your production environments are Managed Environments. Custom alerts and recommendations only exist there. If production is unmanaged, decide whether that is still a choice you are happy with.
- Open Monitor, then Copilot Studio, and write down what you see. Which agents appear, what their success rates are, and how many sessions they ran. If an agent you expected is missing, find out whether anyone is using it.
- Create two or three custom alerts on the agents that would hurt if they failed. A reasonable starting rule is agent session success rate Is Under 90 percent, severity High, notification type Email. Tighten or loosen the threshold once you have a week of real numbers.
- Allowlist
PowerPlat-noreply@microsoft.com. An alert that lands in junk is not an alert. - Name the rules so a stranger could understand them. Something like "Prod - Customer triage agent - success rate under 90" will still make sense in six months.
- Reserve low-latency alerts for one or two critical agents. You only get ten in the tenant, they are still preview, and they are not real time. Use them where a full day of silence would be too long.
- If your operations team lives in Teams, wire up the alert-fires flow. Start with one High severity rule posting to an operations channel, and see whether people act on it before you build anything cleverer.
- Sit down with the maker of each busy agent and compare views. You bring Monitor. They bring Copilot Studio analytics. Agree who owns a drop in success rate and what "good" looks like.
- Put this on your CV if you have done the work. "Configured Copilot Studio" is fine. "Set operational health metrics and alerts for production Copilot Studio agents, and used them to catch and fix failing runs" is better, provided it is true.
What to do next
- Browse current D365 jobs and look for Power Platform admin, centre of excellence and solution architect roles that now need agent operations skills.
- Check D365 salaries before your next review or contract conversation.
- If you are a consultant who can offer agent health reviews, make that obvious on your profile. Employers hiring that talent can post a role.
- Explore the products and vendors around Copilot Studio, monitoring and managed services for Dynamics 365.